Analyze a dataset with Analyst
Ask a spreadsheet questions in plain English and get back the answer and the chart — no pivot tables, no formulas, no waiting on someone who "knows Excel."
Stage: First-Party Agents · For: Manager, Maker · Level: Starter · Time: 10 min
Status: Generally available — verify current availability on the Agents in Microsoft 365 roster.
When to use this
You have a data file — sales by product, tickets by week, spend by team — and a question you can't answer at a glance. Normally that means wrestling a pivot table or pinging the one analyst on the team. Analyst is the prebuilt first-party agent for exactly this: it reasons over your data, runs the analysis, and hands back charts and findings. It even works through its steps in the open, so you can see how it got the number, not just the number.
It's the natural companion to Researcher: Researcher frames the story, Analyst crunches the data behind it. Try this once and "let me build a chart" stops being a chore you avoid.
What you'll need
- M365 Copilot license with access to the Analyst agent (Agent Store / agents rail in Copilot)
- A structured data file — an Excel workbook or CSV with clean column headers works best
- A real question, the sharper the better ("top 5 products by margin," not "tell me about sales")
Try it now — the prompt
Open Analyst, attach or reference your file, and ask a pointed question:
@Analyst from this sales file, show me the top 5 products by margin and each one's
month-over-month trend for the last 6 months. Call out anything that's growing or
declining fast, and give me a chart I can drop into a deck.
Why this works: it names the metric (margin), the ranking (top 5), the time frame (6 months, month over month), and the output (a chart for a deck). Analyst does best when the question is specific and measurable — vague questions get vague analysis.
Step by step
- Open Analyst and bring in your data. Find it in the Agent Store or agents rail, start a conversation, and attach or point to your file.
- Ask your question. Analyst inspects the data, plans the analysis, and works through it in steps — you can watch the reasoning and the code it runs.
- Read the findings and the chart, then sanity-check. Confirm the numbers are in a believable range and that Analyst used the columns you expected. A quick gut-check on one figure builds trust in the rest.
- Iterate like you're talking to an analyst: Analyst reruns just that slice and updates the chart.
Screenshots
Captured live in Microsoft 365 Copilot with the Analyst agent. The product UI moves fast — if what you see differs, trust the numbered steps above, which we keep current.
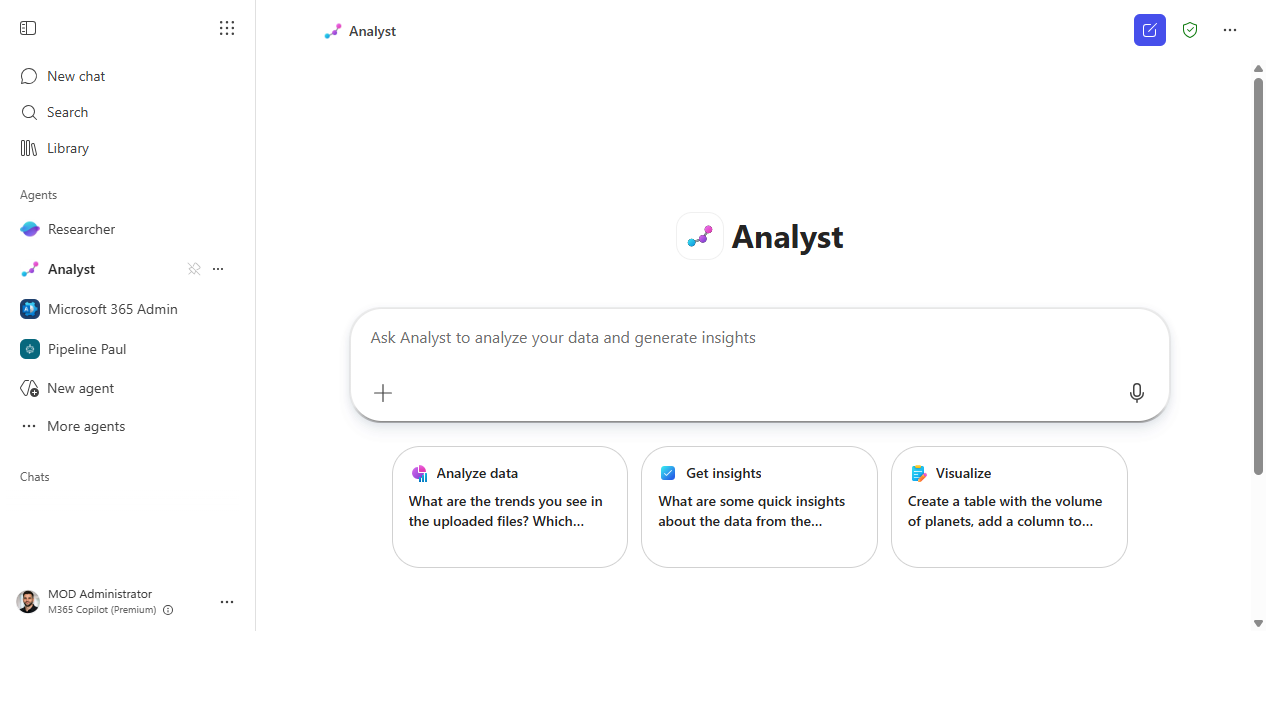 Open Analyst. Start a conversation with the prebuilt Analyst agent — it suggests data-first prompts to get you going.
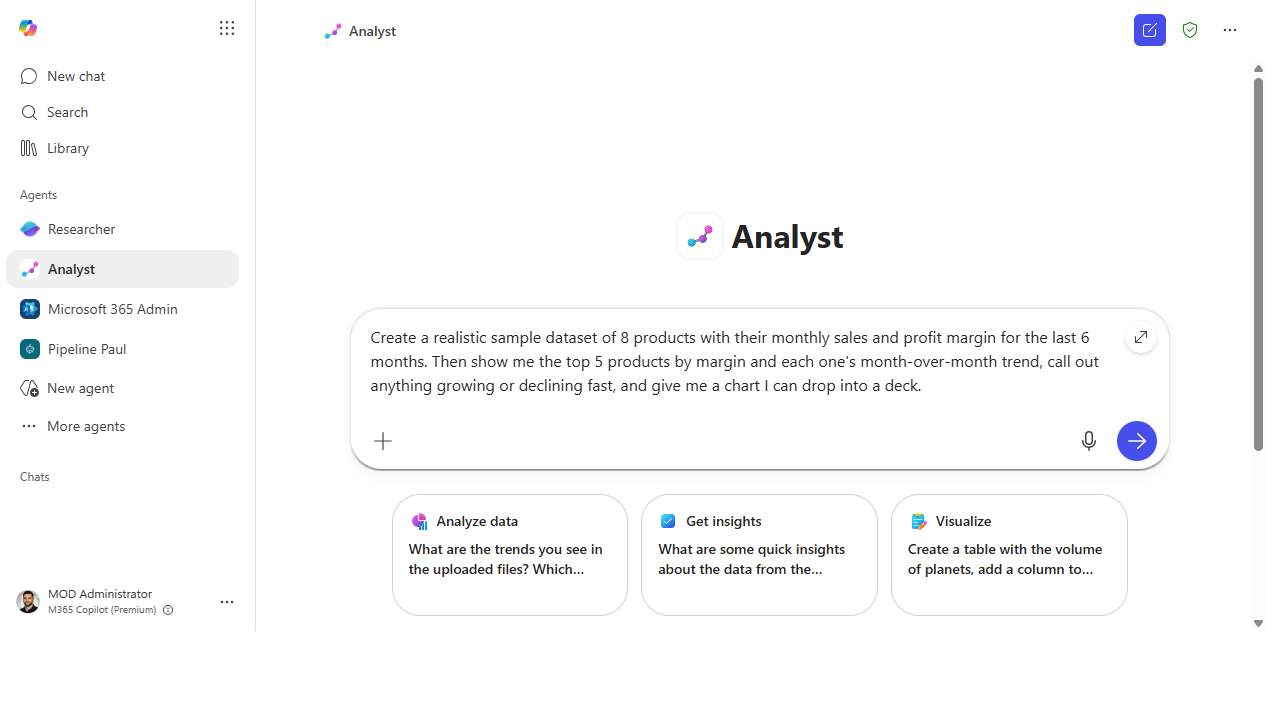 Ask a pointed question. Name the metric, the ranking, the time frame, and the output you want.
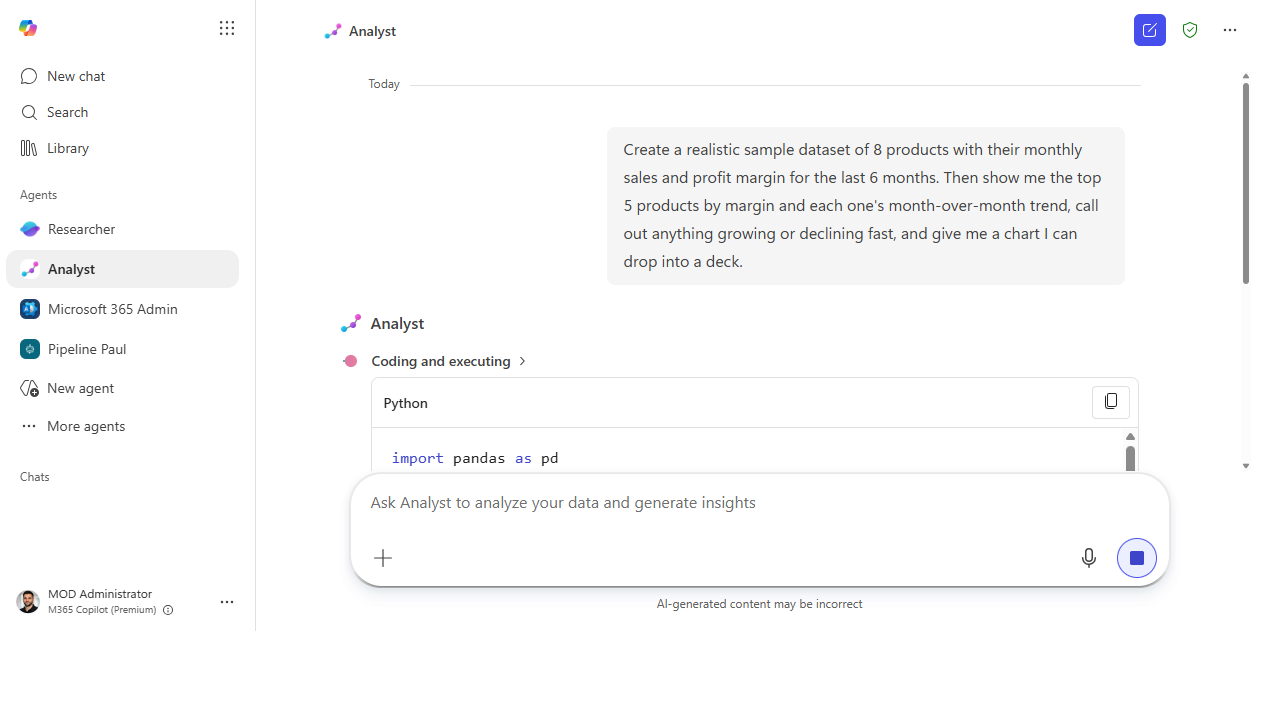 Watch it work. Analyst writes and runs code in the open — so you can see how it got the number, not just the number.
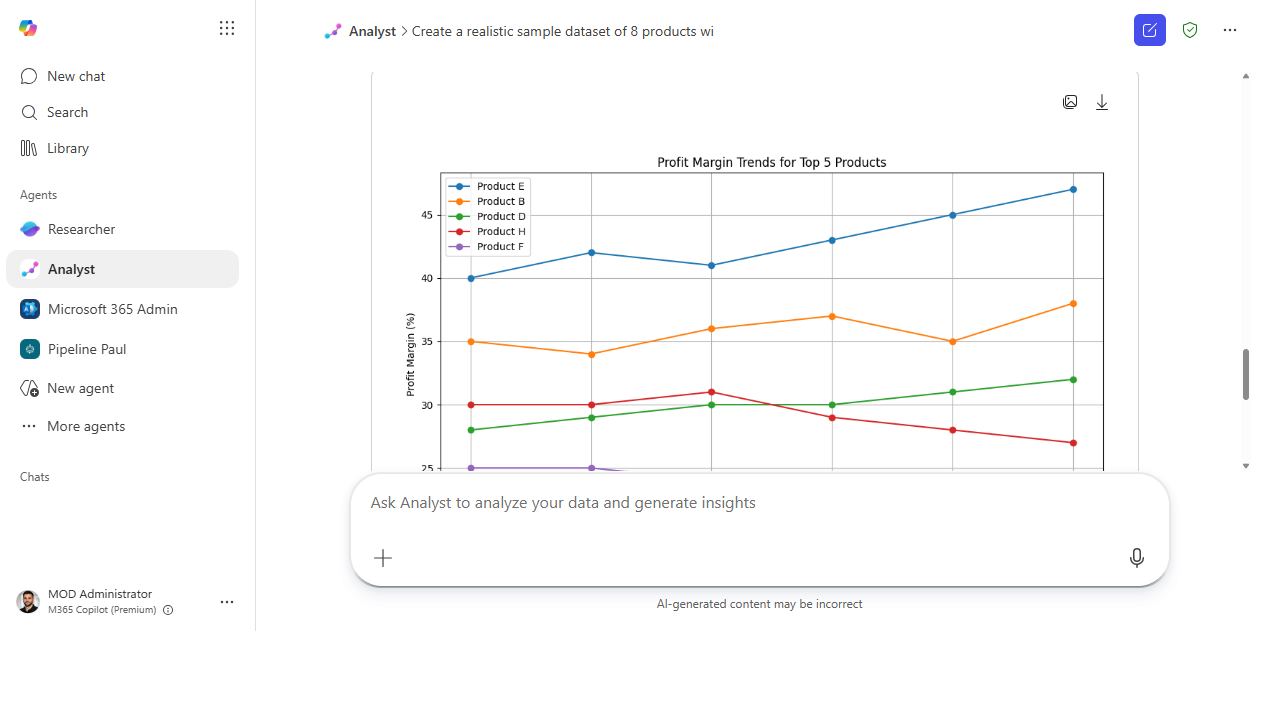 A chart you can drop into a deck. Analyst returns the findings and the visual, ready to reuse.
Make it better
A first chart is the start of a conversation, not the end: - Reshape the output. Ask for a different chart type, a summary table, or a one-paragraph readout for an exec who won't open the file. - Test a hypothesis. "Is the Q2 dip seasonal or new?" — Analyst can compare against prior years if the data's there. - Chain it with Researcher. Have Researcher explain why the market's moving, then Analyst quantify it in your numbers. Pairing the two prebuilt agents is the real first-party power move.
📚 Learn more. The Agents in Microsoft 365 Adoption Hub describes Analyst and the other prebuilt agents in plain language, and Nicole Herskowitz's (CVP, M365 Copilot) blog on enabling human-agent teams explains how these agents work alongside you.
Watch out for
- Check the columns it chose. Analyst infers which fields you mean — if your headers are ambiguous ("Amount" vs "Net"), confirm it picked the right one before you trust the result.
- Clean data in, trustworthy chart out. Merged cells, blank rows, and mixed formats trip up any analysis. If a result looks off, the data shape is the usual culprit.
- Show your work before you forward it. Analyst exposes its steps for a reason — for anything that feeds a real decision, glance at how it got there, not just the headline number.
Where this leads (the ramp)
You just delegated a whole analysis job — inspect, compute, visualize — to an agent. The next step isn't a bigger analysis; it's a bigger scope: hand off a task that spans several tools at once. Stage 3 · Cowork is where you say "pull the data, analyze it, and build the summary deck," and Copilot runs the whole chain.
Related
- First-Party → Auto-recap every meeting with Facilitator — the Stage 2 flagship
- First-Party → Deep-dive a topic with Researcher — its natural pairing
- Stage 2 Resources: see
RESOURCES.md→ First-Party Agents
Thanks — glad it helped. Spotted something to improve anyway? Suggest it →
Sorry this didn't land. Tell us what broke → so we can fix that rung of the ramp.
Found an issue or want to suggest an improvement? Open a GitHub issue · Star on GitHub